Winter’25 AGrid Release Notes
.svg)
Table of Contents
Welcome to the AGrid Winter ’25 release! Get ready for exciting new features that make managing and viewing Salesforce data simpler than ever. Whether you’re an admin or an end-user, this update brings tools to help you work smarter and faster, all without needing to write a single line of code.
Quick Summary
- Data Visualization with Embedded Charts
- Dynamic Kanban View
- User-Level Conditional Highlighting
- Column Freezing for Enhanced Navigation
- A Fresh Look for AGrid Headers
- Default Record Loading Configuration
- Grid Settings Redesign
- Enhanced Data Customization
- Data Index Column
Let’s dive in and see how AGrid can make your Salesforce experience better than ever!
What’s New?
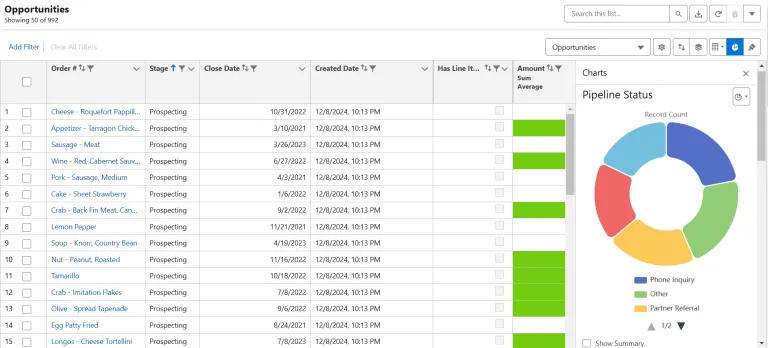
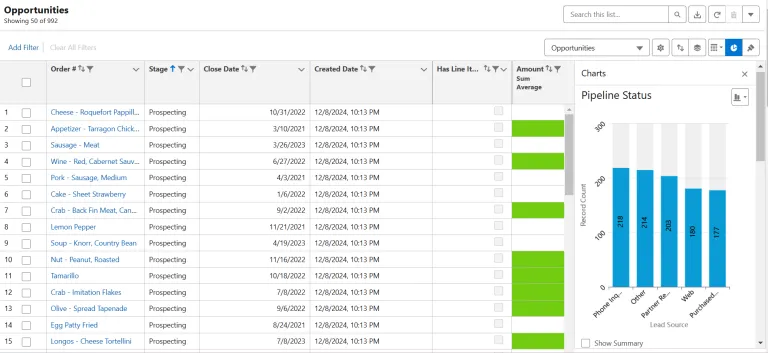
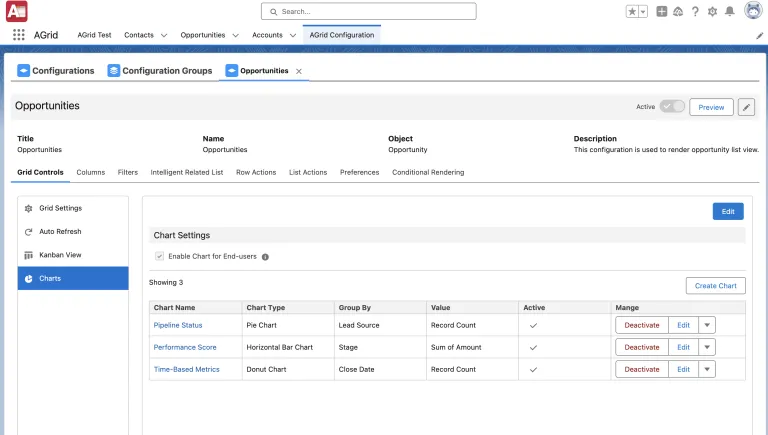
Data Visualization with Embedded Charts
Gain actionable insights with the all-new chart feature in AGrid. Whether it’s sales performance or customer segmentation, you can now visualize your data directly within your grid.
- Chart Types: Supports Bar, Pie, Donut, and Line charts for comprehensive data analysis.
- Interactive Insights: Charts update dynamically with grid data changes for real-time insights.
- Admin and End-User Access: Admins can configure charts while end-users can toggle views.
- Multi-Chart Support: Create and switch between multiple charts for different data perspectives.
Use Case: Monitor lead distribution by source or analyze revenue by region at a glance.
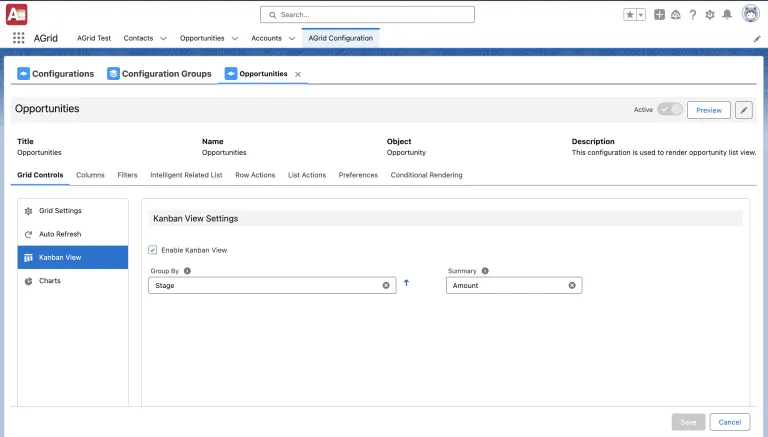
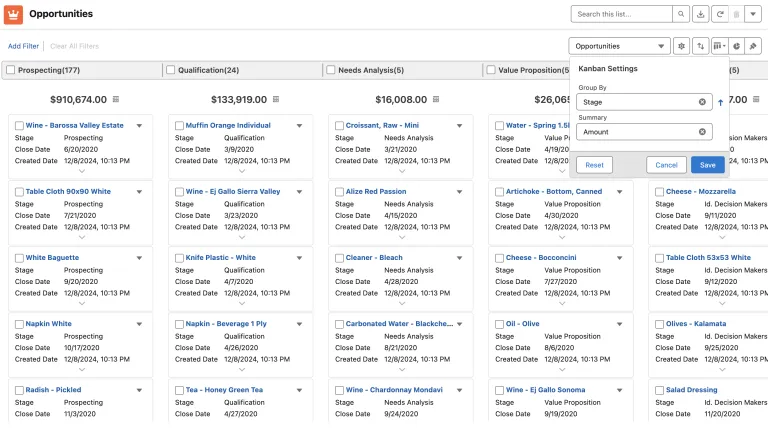
Dynamic Kanban View
Track progress and manage workflows with the intuitive Kanban View. Drag and drop records to update their status effortlessly.
- Visual Organization: Group records by fields like Status, Priority, or Custom Fields for clear visibility.
- Real-Time Updates: Instantly reflect changes across stages with a simple drag-and-drop.
- Advanced Summaries: View record counts and calculate numeric field summaries like totals and averages.
Use Case: Perfect for sales pipelines, project task tracking, or managing customer support cases.
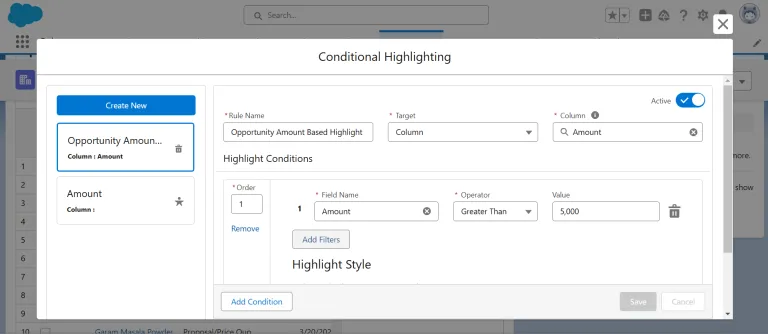
User-Level Conditional Highlighting
End-users can now take charge of their data visualization by applying personalized highlights to critical data points. This feature allows users to:
- Set custom rules to apply color-coded highlights based on specific conditions, such as overdue tasks or high-priority leads.
- Easily identify trends and outliers with intuitive, visual cues directly in the grid.
- Combine multiple conditions with AND/OR logic for advanced customization of their data views.
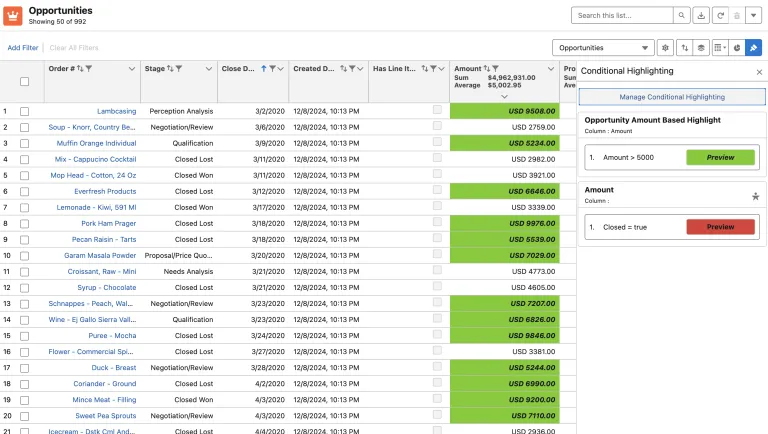
This makes it easier than ever for users to focus on what matters most, boosting efficiency and enabling quicker decision-making.
- Custom Rules: Apply color-coded highlights for trends, outliers, or specific conditions.
- Admin-Free Configuration: Users can set their own rules for personalized data insights.
- Flexibility: Combine multiple conditions with AND/OR logic for advanced customization.
Column Freezing for Enhanced Navigation
Keep your most important data always in view! With Column Freezing, you can lock specific columns while scrolling through wide datasets, ensuring you never lose track of critical information. This makes navigating your data smooth and hassle-free, whether you’re working with a few rows or thousands.
- Customizable Freezing: Admins and users can lock specific columns, ensuring they stay visible.
- Seamless Scrolling: Navigate wide tables without compromising on key details.
- Maximize Productivity: Freeze up to three columns for a tailored data review experience.
Winter’25 Enhancements
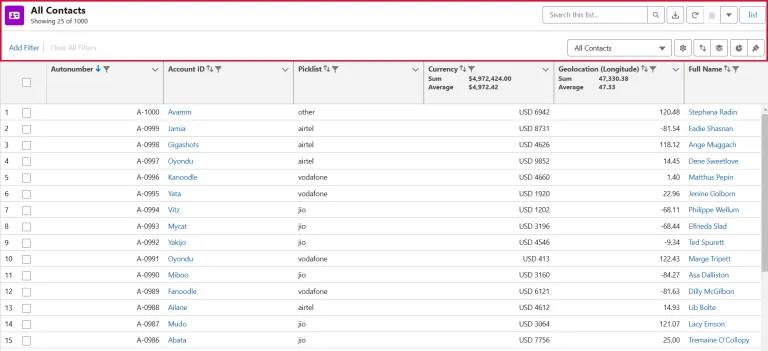
A Fresh Look for AGrid Headers
The redesigned end-user grid header is here to transform your interactions with AGrid. Inspired by user feedback, this sleek, intuitive interface ensures you can access key features with ease.
- Key Features at a Glance: Sorting, filtering, and grouping options are now front and center, eliminating unnecessary complexity.
- Search and Filters Made Simple: Prominently displayed and easy to use, these tools help you locate data faster than ever.
- Guided Navigation: Redesigned icons and tooltips simplify workflows, making it easier for new users to get started.
Why It Matters:
- Navigate faster with an organized, user-friendly layout.
- Perform tasks like sorting and grouping with fewer clicks.
- Experience updates driven by real feedback from users like you.
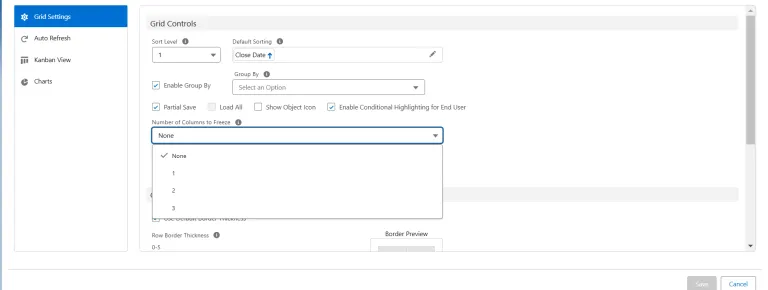
Default Record Loading Configuration
Take control of how your data is presented by setting default record loads for both Table and Card views. Whether you need a quick glance at a few records or a deep dive into larger datasets, this feature makes it easy to customize your experience.
- Configurable Options: Load 25, 50, 75, or 100 records, striking the perfect balance between speed and detail based on organizational needs.
- Improved Efficiency: Balance data visibility with faster page load times.
- User Experience: Customize record loading to suit device types and screen sizes.
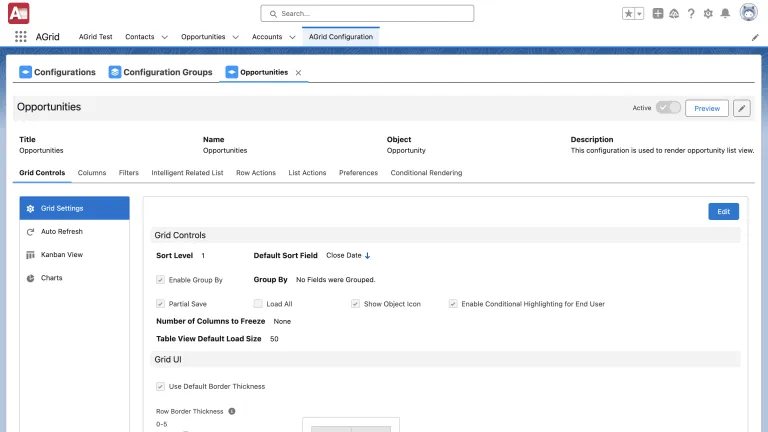
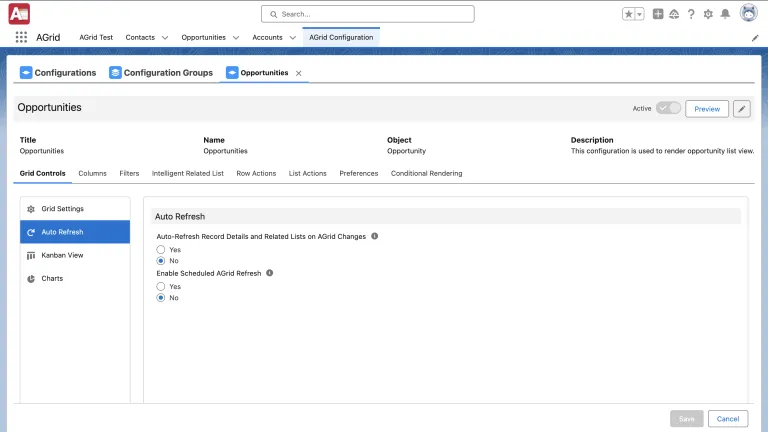
Grid Settings Redesign
The redesigned Grid Settings tab introduces intuitive sub-tabs that make configuring your grid a breeze. These sub-tabs neatly organize features and their associated setups, ensuring you can:
- Switch Seamlessly Between Features: Quickly navigate to any feature’s specific settings with a single click.
- Access Related Options Instantly: Each sub-tab reveals its relevant fields and configurations, saving you time and effort.
- Improve Usability: The new layout ensures that even complex setups feel straightforward and accessible
Data Index Column
Easily track rows with the new Data Index Column, ideal for large datasets. This simple yet powerful feature adds a numbered index to each row, helping you navigate and manage extensive grids effortlessly.
- Quick Reference: Numbered rows simplify navigation and referencing.
- Actionable Views: Combine this feature with grouping and sorting to streamline data reviews.
Show Object Icon
A simple yet practical enhancement is now under the Grid Settings tab. This setting allows administrators to control whether the icon representing the configured Salesforce object is displayed within the AGrid Configuration.
With this feature, you can tailor the grid’s visual appearance to align with end-user preferences and specific business requirements.
Ready to Transform with AI?
More Insights for you